Notes: AI Bubble? Refining the Forward ROIC
Summary
- The refined forward ROIC model focuses on Microsoft, Amazon, and Google, excluding Apple and Meta due to differing RPO dynamics and consumer-heavy business models.
- Adjustments made are on boththe denominator (IC) numerator (return) side of ROIC to better align RPO with AI-related capex.
- The revised model yields a two-year forward ROIC of 28.6%, exceeding the estimated two-year forward WACC of 16%, indicating current AI capex remains value-creative.
- While estimates carry uncertainty, the framework encourages further refinement to judge whether rising AI capex is sustainable or nearing overreach.
Overview of the Forward ROIC Refinement
In this follow-on to our AI Bubble note, we refine the forward-looking Return on Invested Capital (ROIC) framework introduced earlier. The scope is narrowed to the three core hyperscalers — Microsoft, Amazon, and Google — excluding Apple and Meta. Both are primarily consumer-facing, with business models and capital allocation strategies that make RPO-based ROIC estimates less meaningful.
Apple’s RPO is relatively small ($45B as of 2Q25) and tied to consumer services such as iCloud and the App Store, while its capex is concentrated in hardware manufacturing (e.g., device chips) rather than scalable AI infrastructure. Meta’s RPO is also modest ($33B) due to its ad-driven, non-subscription-heavy model, and its AI investments are largely internal (e.g., ranking and recommendation) rather than tied to external revenue commitments.
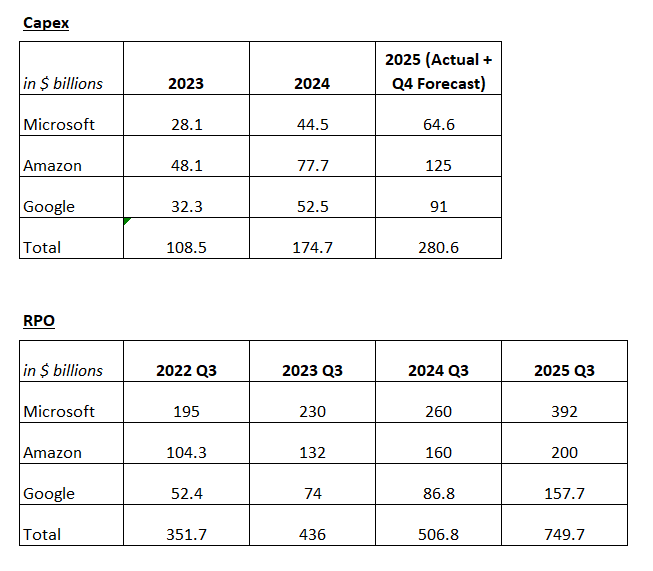
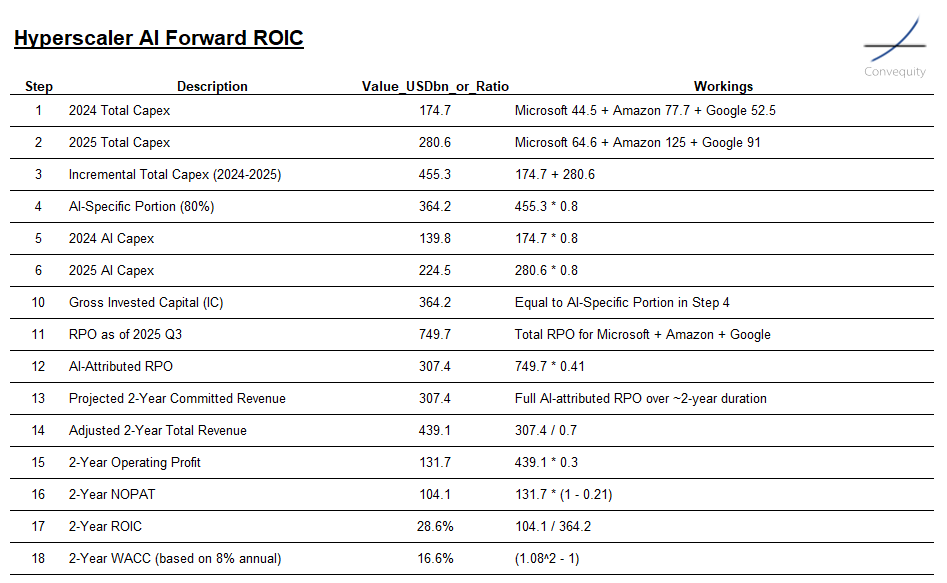
The invested capital base is defined as incremental AI-specific capex over 2024–2025 on a gross basis (before depreciation) — a change from the prior model, which netted off accumulated depreciation. We now view the gross approach as the most appropriate denominator, as it captures the full step-change in AI infrastructure spending and represents the capital currently being deployed to enable future AI-driven revenue. We deliberately do not subtract depreciation, because it already flows through the P&L and is embedded in the operating margin used to derive NOPAT; netting it off the capital base as well would double-count the same cost and artificially inflate ROIC. Traditional ROIC, by contrast, divides historical NOPAT by average invested capital, which obscures the sharp inflection in AI-related outlays. Focusing on recent incremental AI capex allows the model to align with the present build-out cycle and the returns it is expected to generate.
On the returns side (numerator), two key adjustments improve consistency with this AI-specific capital base. First, rather than using total RPO to proxy two-year forward revenue, we adjust RPO to reflect only the share of backlog attributable to AI-related services, avoiding a mismatch between AI-specific capex and non-AI revenue. This isolates the portion of future revenue that is actually supported by the AI infrastructure being built. Second, we address the portion of hyperscaler revenue that is not captured in RPO — namely, on-demand or usage-based consumption. To account for this, we apply an uplift factor to AI-attributed RPO based on each company’s revenue recognition profile. This ensures that forward revenue projections capture both committed and on-demand elements of AI monetization.
We use a two-year horizon because it matches both sides of the equation: it’s the period over which this AI capex spike has occurred and is also roughly the blended duration of hyperscaler RPO (based on filings and analyst estimates). That way, the modeled revenues line up with the payback window for the recent AI investments. To derive profitability, we apply a blended 30% operating margin — the midpoint across IaaS, PaaS, and SaaS — broadly consistent with disclosed cloud margins (AWS ~34%, Google Cloud ~24%, with Azure likely higher). Although imperfect, this gives a reasonable ecosystem-wide estimate given limited visibility into AI-specific gross margins. We then apply a 21% tax rate to arrive at forward-looking NOPAT; this is probably conservative given 100% bonus depreciation on qualifying AI capex, which will depress taxable income and lower the effective rate in practice.
On these assumptions, the model produces about $104bn of two-year NOPAT on $364bn of AI-specific incremental capex — a 2-year ROIC of ~28.6%. To judge whether that’s value-creative, we compare it to a 2-year cost of capital rather than an annual one. With an 8% annual WACC, the 2-year hurdle is (1.08² − 1) ≈ 16.6%, which we round to ~16%. As long as forward ROIC sits comfortably above that level, the AI capex cycle looks economically rational; if it slips below, especially as RPO growth slows while investment stays elevated, it would start to flag emerging overcapacity and bubble risk.
Source: Convequity
Detailed Logic for Key Steps
Step 3: Incremental Total Capex (2024-2025)
We focus on incremental capex ($455.3B) over the past two years to isolate recent AI-driven investments, rather than cumulative historical spend. This avoids diluting the analysis with legacy non-AI assets (e.g., pre-2023 data centers), providing a cleaner forward view of returns on fresh capital deployed amid the AI boom.
Step 4: AI-Specific Portion (80%)
The 80% AI attribution stems from Q3 2025 earnings calls and filings: Microsoft noted 80% of capex tied to cloud/AI (e.g., GPU clusters); AWS emphasized AI as the primary driver (75-85% of growth capex); Google highlighted ~80% for AI infra. This conservative blend reflects analyst consensus that AI dominates recent spend, per reports from firms like JPMorgan.
Step 12: AI-Attributed RPO
To attribute 41% of total RPO ($749.7B) to AI: We estimate the legacy RPO base from two years ago (Q3 2023, $436B) was ~20% AI-related (pre-boom, mostly non-AI cloud). Over the two-year period, net RPO growth ($313.7B) is ~70% AI-driven (per earnings: AI workloads fueling 60-80% of backlog increases). Thus: AI RPO = (20% × $436B) + (70% × $313.7B) = ~$307.4B, or 41% of total. This weights historical vs. recent AI acceleration.
Step 13: Projected 2-Year Committed Revenue
We convert the full AI-attributed RPO ($307.4B) to projected two-year committed revenue, as RPO represents backlog obligations with an average ~2-year duration (blended current/non-current per filings: ~45-50% current converts in ~1 year, non-current over 2-3 years). This assumes steady fulfillment without major cancellations, providing a direct forward revenue proxy tied to the capex horizon.
Step 14: Adjusted 2-Year Total Revenue
To estimate total revenue, we scale up committed revenue (RPO-based) by 1.43×. This factor reflects that roughly 70% of hyperscaler revenue flows through RPO, meaning total revenue equals RPO ÷ 0.7 (or 1.43 × RPO). The remaining ~30% represents non-RPO or on-demand consumption, such as pay-as-you-go workloads recognized immediately.Across companies, the mix varies slightly:
- Microsoft skews more subscription-heavy, with about 80% committed, helped by AI-bundle contracts.
- For Google, RPO currently equals about 115% of its annualized revenue run rate, meaning its backlog covers just over a year’s worth of sales. This depth reflects strong growth momentum, but it doesn’t mean all revenue is contracted. Based on filings and analyst estimates, roughly 70–80% of Google Cloud’s revenue base is committed, with the rest derived from on-demand usage that isn’t captured in RPO.
- AWS has historically operated around a 60/40 committed/on-demand split but is trending closer to 70/30 as AI-driven capacity guarantees require longer-term commitments.
On balance, a 70/30 committed-to-on-demand ratio provides a reasonable forward assumption, since the economics of AI workloads increasingly favor contractual predictability (largely because CSPs rent out in whole servers and/or racks as opposed to elastic instances).
Step 15: 2-Year Operating Profit
We apply a 30% operating margin to projected revenue for simplicity, drawing from disclosed cloud margins (AWS ~34% in Q3 2025, Google Cloud ~24%, Azure ~40%). This blends IaaS (hardware-intensive, lower margins), PaaS, and SaaS (higher at 60-80%), without perfect segmentation. Variations exist due to scale/efficiency differences, but it's the best proxy for deriving NOPAT, capturing ecosystem uplift from AI-enabled services.
Step 16: 2-Year NOPAT
From operating profit, we deduct a 21% effective tax rate (U.S. corporate standard, aligned with hyperscalers' global blended rates per filings) to reach NOPAT (although the effective tax will likely be notably less, especially given the 100% depreciation allowance for the 1st year following AI-related capex). This after-tax figure ensures ROIC reflects true economic profit, net of taxes but before financing costs.
Conclusion
The refined forward ROIC model produces a 2-year ROIC of 28.6%, suggesting that hyperscaler AI investments remain value-creative at present — comfortably above the estimated 2-year 18% WACC. While returns have moderated from the 33.8% result in our earlier model, the updated methodology offers a more disciplined and realistic view of the economics underpinning AI infrastructure spending. The decline reflects the two refinements made on the numerator side — isolating AI-specific RPO and adjusting for on-demand revenue not captured in RPO — which bring greater consistency between invested capital and returns.
That said, this exercise inherently involves a high degree of estimation and uncertainty. The opacity of company disclosures, the evolving nature of AI monetization, and the complexity of attributing RPO to AI-specific workloads all make this a non-trivial modeling challenge. These results should therefore be viewed not as definitive, but as a structured attempt to frame the debate using the best data and assumptions available.
Despite its imperfections, the analysis matters. The discipline of quantifying AI ROIC — even with acknowledged limitations — helps the investment community anchor discussions of value creation versus speculative excess in something more rigorous than narrative. By setting out a transparent framework, we invite others to build upon, refine, and challenge these estimates. Over time, that collective effort will help investors determine for themselves whether the AI build-out represents a sustainable new paradigm or an emerging bubble.
For now, the evidence suggests that the AI cycle remains rational, with returns still exceeding capital costs. Yet the margin of safety is narrowing. As capex accelerates and visibility into AI-driven revenue lags, forward ROIC will be an increasingly vital gauge of whether the industry is compounding value — or approaching its point of overreach.