Q1 CY23 Overview Of Key Cybersecurity Players. PANW, FTNT, S, NET, ZS & SNOW

Summary
- Quarterly reviews and valuation overview.
- Key tailwinds summary for key cybersecurity players.
- Next report is revisiting the thesis on Okta.
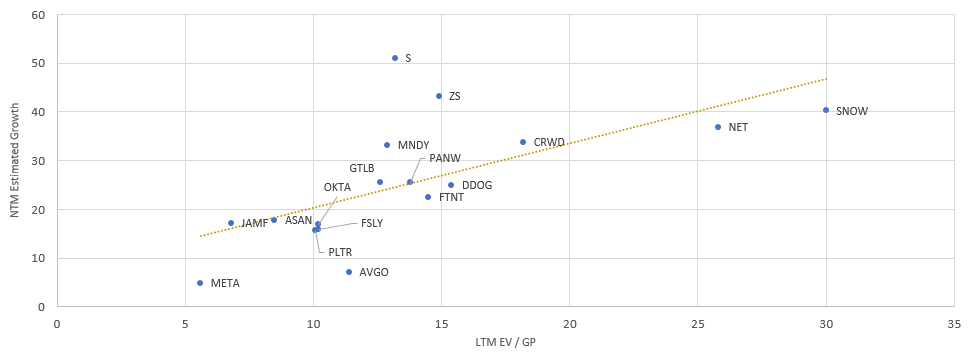
Here are the public companies we cover – mostly cybersecurity names but a few names in adjacent markets. Cybersecurity has not been unaffected by the deteriorating economic climate, but it has proven resilient compared to other tech sectors. The scatter plot positions these stocks according to their NTM estimated growth (on the y-axis) and the EV/GP LTM (on the x-axis). The line of best fit has been imposed by the least squares method calculation.

Generally, the stocks on the line of best can be considered fairly valued, while those above can considered relatively undervalued and those underneath can be considered relatively overvalued. Comparing NTM growth with EV/GP may seem unusual, but as we’ve shared with our subscribers before, we believe it’s a metric that removes the opaqueness of EV/S and the noisiness (or incalculability) of EV/EBITDA. Furthermore, it factors in gross margin, which is an important metric to assess the mature-stage profitability of such high-growth, GAAP loss-making, software stocks.
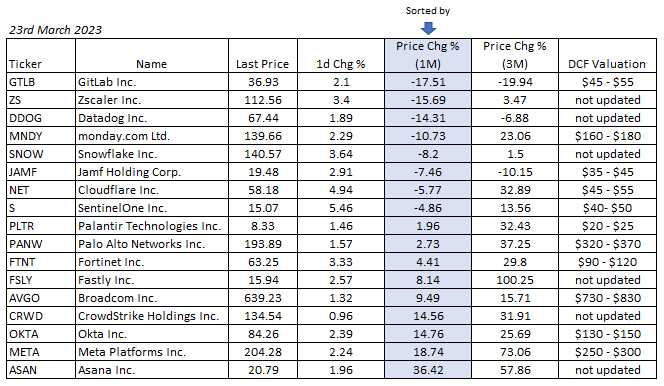
Below are these stocks sorted by the one-month price change. For those market timers, seeing which stocks have declined during the past month and are above the NTM growth vs EV/GP line of best fit, might be a useful insight. Alternatively, applying a momentum market timing strategy with the above chart might also be effective. In the table we also share our intrinsic value estimate on those stocks we have conducted a DCF valuation recently. Many intrinsic value estimates will not match up with the scatter plot because of the explicit growth forecast period. We typically apply a 15-year forecast period for the stocks we follow, as we anticipate durable growth that will decelerate slower than what is typically modelled by the market.

In the following sections we’ll provide an overview and most recent quarter update for select stocks.
PANW
Since 2021, PANW has delivered consistently solid growth of 25%-30%. The guidance for 3Q23 (quarter ending 30th April) is 23.5% and for FY23 (year ending 31st July) is 25.5%. As the business is generating TTM revenue in excess of $6bn, even if growth decelerates to mid-teens, PANW will still be grabbing sizeable market share gains to cement itself as a future-proof, long-term, cybersecurity winner.
Gross margin has recovered in the latest quarter, thanks to supply chain bottlenecks easing up, but also this might be a sign that PANW is achieving leverage with its platform (expanding breadth) and vertical (data layer) integrations.
In 3Q23, PANW delivering a whopping FCF margin of 39%, pushing it to a Rule of 64. It’s also nice to see its EBIT steadily improve each quarter by a few percentage points. Generally, this is a very favourable business performance for the current investing climate whereby investors are bidding up those stocks that are generating resilient growth and increasing margins and FCF via cost cutting and finding operating levers.
Following the stock’s 37% appreciation in the past three months, PANW is trading right on the NTM growth vs EV/GP line of best fit. Therefore, in the intermediate term there doesn’t appear to be any major alpha catalyst, though momentum may push the stock higher. The consensus growth estimates for FY24 and FY25 are 22% and 19%, which is aligned to our own projections. However, over the next 2-4 years, we do believe they will become the first pure-play $100bn cybersecurity company, with various heuristics pertaining to the TAM of cybersecurity and cloud security more specifically, supporting this prediction.
The key tailwinds for PANW are:
- Cloud security >>> shift-left, shift-right, and in the future a market refocus on real-time protection. We really envisage PANW’s Prisma Cloud becoming a security supercloud for multicloud environments.
- Hybrid environments >>> distributed enterprises need vendors that can secure hybrid environments. PANW has it all to secure such networks - firewalls for on-prem, firewalls via SASE, firewalls in VM form factor for intra/inter cloud networking, and firewalls with integrated SD-WAN for optimal networking performance.
- Security Operations >>> it is becoming increasingly clear that security defenses need autonomous software and SecOps manpower with programmability at their fingertips. PANW’s XDR & data stack is ideal for autonomously stopping the majority of threats and enabling SecOps teams to customize their defenses to combat the more sophisticated threats.
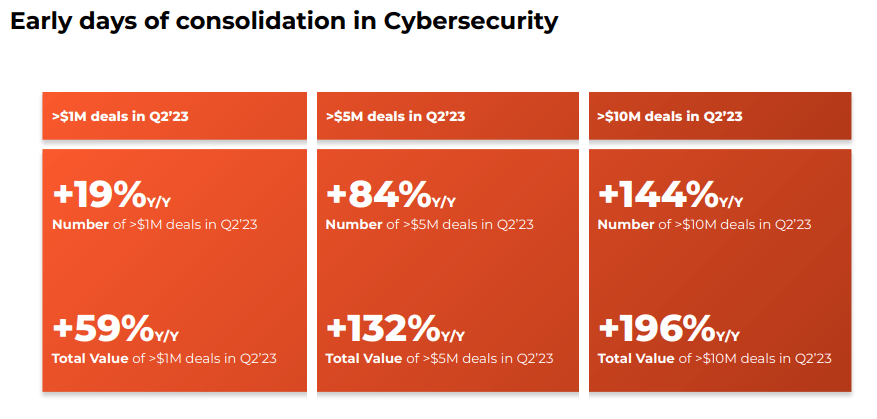
- Vendor consolidation >>> CISOs paradoxically want consolidation and BoB – with PANW they get both. The VC de-risking and SVB collapse will wipe out many early-stage startups, especially if there is an insidious contagion underway. This will give PANW more opportunity to benefit as the consolidation vendor. We think the growth in the number of $10m+ deals in 2Q23 is a sign that the trend is already underway.

FTNT
FTNT’s recent quarterly performances have been very similar to PANW but with a higher growth rate at a lower revenue level (nearly $2bn lower). Unbelievably over the past four years FTNT has sustained a TTM FCF margin of mid-30s while accelerating growth from 20% to 30%+. This has pushed it to producing one of the best Rule of 40s among its peers.
Like PANW, FTNT’s business performance consisting of resilient growth and improving margins and cash flows has attracted investors during the past few months. In the intermediate term, except for possible momentum, we do not see any major alpha opportunity – as can be seen on the scatter plot, FTNT is underneath the line of best fit. Though, longer-term, as indicated by our intrinsic value estimate, we believe there is substantial upside. We believe our comparative bullishness derives from our projections on the company’s very durable growth (in part thanks to increasing enterprise penetration), its high terminal FCF margin (thanks to its data centre strategy), and its low cost of capital (thanks to its geographic, market, and vertical diversification).
On a technical front we believe FTNT will outperform over the long-term thanks to its advantages in converged networking and security. The company’s hardware R&D and integration has resulted in an extremely compact and affordable all-in-one appliance (replacing 4 or 5 separate boxes) that works as both a router and a NGFW. Not only that, the FortiGate has multifold greater power and power efficiency than rivals products. In essence, you can place the FortiGate anywhere (on-prem, PoP, home office, etc.) and get SASE – that is, converged networking and security.
What Ken Xie and FTNT has achieved is probably the most underappreciated strategy in all of tech. We can only think of Apple and Tesla that have successfully executed this level of in-house software and hardware integration. And as data volumes rise and the demands on networking and security grow, FTNT’s superiority will become increasingly clear.
Key tailwinds are:
- Hybrid environments >>> distributed enterprises managing more and more data will increasingly need better network/security performance. They want a Zero Trust architecture but this adds latency, hence FTNT can offset this by providing the superior compute at the hardware level and superior networking at the software level.
- Vendor consolidation >>> like PANW, FTNT has one of the broadest security platforms, with many BoB solutions.
- CSMA >>> the Cybersecurity Mesh Architecture is a term coined by Gartner but invented by FTNT. Vendor consolidation is on the horizon, but no single vendor can be the sole replacement. This is why CSMA - a broad security platform that is highly interoperable with third-party solutions and powered by an underlying security analytics and intelligence layer (aka SIEM) - is the future of cybersecurity.
- OT security >>> enterprises with operational technology residing in factories need to connect them online to drive digital transformation and gain a competitive edge. Securing such OT requires specialist knowhow because traditional security software is not compatible with many of these dated and nonstandard operating systems and appliances. FTNT’s affordability and excellence in software-defined approaches make it a top candidate in the high-growth segment of cybersecurity.
S
S has been sustaining incredible growth, even as its ARR surpasses the half a billion-dollar revenue threshold. The XDR leader generated 92% revenue growth in 4Q23, and continues to increase its gross margin at a rapid rate, attributed to greater scale and data-enabled efficiencies related to its 2021 Scalyr acquisition. Furthermore, its EBIT margin is getting closer to breakeven by about 10 percentage points each quarter. This has led to dramatically lower cash burn and a Rule of 74 in the latest quarter.
For 1Q24, management expects 75% revenue growth and for FY24 (year ending 31st Jan) they expect 50% growth. Part of the deceleration is natural market mechanics as the business surpasses $400m in revenue, and part is attributed to a degree of cautiousness. If S can sustain its impressive NDR of 130%+, then 50% growth for FY24 should be easily doable, as it implies they only need 20% growth from new logos.
The impressive 130% NDR is largely attributable to their GTM momentum with MSSPs. S has designed their entire XDR and data stack to be very in tune to the needs of MSSPs – from the 1) highly autonomous front-end agent that radically reduces the monotonous workload burden, to the 2) programmable platform that empowers MSSPs (and in-house SOC) to customise detections and responses, to a 3) highly performant and cost-effective data backend which enables speedy investigations and affordable data retention. This is a very differentiated strategy to CRWD’s (which largely operates as a MSSP itself), and is winning over many MSSPs.
These MSSPs will initially test S on a few endpoints and a couple of customers, and after experiencing the value they are quickly expanding their S deployment. The MSSP growth has been supported by many SMBs and enterprises turning to managed services to assist them in this climate of rising cybercrime volume and sophistication.
In accordance to S’ position on the scatter plot and our own intrinsic valuation, we believe S is extremely undervalued. Our take is that there are three clear leaders in the XDR space, which are PANW, CRWD, and S, and these vendors have an enormous opportunity ahead to replace the legacy antivirus vendors installed at the high majority of organisations. For S, not only are they one of the three leaders, they have a very differentiated architecture and GTM strategy to the next-gen leader CRWD that will continue to help them close the market leadership gap. Therefore, S are well-positioned to maintain high growth for a few years to come. Furthermore, there are more efficiency gains ahead as S continues leveraging Scalyr (rebranded as DataSet) and normalizes opex over time. The growing penetration of MSSPs and large enterprises will also lift its margins higher.
Key tailwinds for S are:
- Security Operations >>> XDR is an S-Curve on EDR, which is an S-Curve of legacy AV. Therefore, there is a very long runway of growth for S in its core endpoint security market. The potential growth in the broader Security Operations market is also very attractive.
- Cloud security >>> S probably has the best agent for real-time runtime protection for cloud-native hosts and workloads. And this statement is supported by Wiz, the next-gen agentless CNAPP vendor, choosing to partner with S to provide customers with real-time protection. Our prior research signals that real-time protection will make a resurgence within cloud security, and when it does, S will be competitively positioned to take full advantage.
- Identity >>> a not so obvious tailwind for S is the identity space. Last year they acquired Attivo, a leader in ITDR (Identity Threat Detection & Response), which is becoming a crucial technology to protect against credential-based attacks. Having ITDR also opens the door to potential growth in adjacent identity markets.
NET
NET has thus far managed its business well during the current climate – offsetting declining growth with rising EBIT and FCF margins. However, its Rule of 40 has never been elite; in the past two years the TTM Rule of 40 has been in the 40% to 50% range. This is because NET is heavily capex dependent to grow their business. NET’s LTM capex percentage of revenue is 14%, while even other vendors that rely on colocation data centres, like FTNT and ZS, have LTM capex of about 6% of revenue. But now that NET has more than 250 PoPs, there is a diminishing return to adding more data centres. Therefore, going forward, it is likely that the capex % will come down and the FCF margin will go up.
What really intrigued us in the 4Q22 ER, is that management provided growth guidance for 1Q23 and FY23 of 37%, which is significantly lower than prior quarters; however, their projected 5-year CAGR is 39%. From this we interpret that management sees the company aggressively expanding presence in newer markets, which will offset any weakness they are currently seeing in their more established markets.
We think projected 5-year CAGR is ambitious, but not overly ambitious. NET’s strategic objective is to become the supercloud for multicloud operations – in essence, becoming the glue that connects the various cloud environments and even become a complete hyperscaler alternative. NET’s R2 is key to this vision, as it is the last piece of puzzle. S3 is the dominant object storage but egress fees are expensive for modern application architectures, because distributed components are fetching data from centralized S3 locations. R2 doesn’t charge egress fees, meaning developers can use NET’s R2 as an S3 alternative, avoid egress fees and have object storage closer to where it needs to go, thus saving costs in networking. The new PLTR partnership may prove instrumental in enabling DevOps teams to quickly evaluate the costs associated with where to host applications, where to do the compute, and where to locate their object storage and databases etc., across the hyperscalers’ and NET’s infrastructure.
Currently NET is mature in providing three of the four pillars of cloud computing – that is, compute, networking, and security. However, it is quickly developing the fourth pillar, storage. This means eventually it will be a bona fide hyperscaler alternative while also being able to be the glue that connects multicloud operations that need cost-effectiveness and superior network performance.
On the security front, NET is experiencing tough comp against PANW, ZS, Netskope, and FTNT in SASE, but is still a top name. They need to develop their channel partnerships because network security is very top-down (which is polar opposite to NET’s DNA of bottom-up) and dependent success in the channel. Our view is that NET’s April 2022 acquisition of Area 1 could be the secret catalyst to win more SASE deals.
On a relative basis, NET is overvalued, positioned below the scatter plot’s line of best fit. From a DCF perspective we also consider NET overvalued by c. 20%. However, for us we think it is a hold and buy the dip stock due to the company’s culture, talent, leadership, and amazing opportunities ahead.
NET’s key tailwinds are:
- Multicloud >>> orgs of all sizes do not want to be locked in to any single cloud provider - this has led to complexity and high costs. NET can be instrumental for enterprises that want greater application and networking performance with lower costs.
- SASE >>> if NET can become as effective at top-down as they are bottom-up, then their presence in SASE will only grow.
ZS
Thus far during the economic downturn ZS has not experienced a substantial drop in growth - only a decline from 60%+ to 50%+ in the past two quarters. Its 18% FCF margin in the latest 2Q23 quarter produced an elite Rule of 70, and EBIT margins are improving by a few percentage points each quarter.
Despite the business performance, ZS' recent share price performance has not been as resilient as other positive FCF and elite Rule of 40 names. This is possibly because its Rule of 40, while still elite, has declined by 10+ percentage points compared to prior quarters. This is because its billings growth has decelerated notable sharper than its key rivals. In 2Q22, 3Q22, and 4Q22, YoY billings growth was 59%, 54%, and 57%. In 1Q23 and 2Q23, it has decelerated to 37% and 34%, respectively. This is because ZS is experiencing elongated deal cycles as enterprises give greater scrutiny to deals. Billings growth guidance remains in the mid-30s range, meaning that ZS' elite Rule of 40 might come under increasing pressure. With all this in mind, despite the relative attractiveness, investors should invest in ZS with caution.
Given the growth rate and the majority of its business being SASE and Zero Trust, we infer that they are likely the leading name in the SASE/SSE space, closely followed behind by PANW. ZS’ GTM DNA is the polar opposite to NET’s, which has served it tremendously well in the SASE market. It has an extremely solid channel GTM strategy, they have about 700 partners selling ZS, winning them over with very attractive rebates for large deals landed. And part of the reason they can do this is because they’ve largely circumvented the distributors (like Ingram Micro and Arrow Electronics), because they don’t need warehouse space as they are purely cloud-delivered.
ZS is the SASE leader but it does have notable disadvantages against rivals in certain areas. It is at a disadvantage to Netskope when it comes to DLP (Data Loss Prevention), and disadvantages to FTNT and NET when it comes to network performance. Additionally, for cloud-native security, it is way behind PANW and the next-gen cloud security startups emerging.
Sidenote: In the first half of 2021 we had a long-term bearish thesis on ZS, predicated on the company's leadership and technological architecture. The stock exploded in the opposite direction, but in the long-term we believe the bearish thesis is still intact. For those institutional investors interested in receiving our prior detailed research on ZS, please book a 30 minute call to discuss.
Management’s guidance for 3Q23 is 38%; still very strong, especially considering the revenue base, and the business is heading for a 43% growth rate for FY23 (year ending 31st July). Considering ZS’ market leadership in SASE (which is a few years away from being a mature market), the elite and well-balanced Rule of 40 (which looks set to continue), and the relative valuation (according to its position on scatter plot), we think ZS offers alpha upside in the intermediate term. However, investors should keep in mind the potential for suppressed billings growth and its impact on the the Rule of 40.
However, we are not bullish over the long-term as we do not see evidence that they are rapid product innovators, in the way the other vendors mentioned thus far are.
ZS’ key tailwinds are:
- SASE >>> this is still a high growth market with a long runway.
- Cloud security >>> if ZS surprises then this could be a future growth driver.
SNOW
Growth has dipped quite sharply in 4Q23 but still 50%+ with 40%-45% expected growth in 1Q24 and 40% expected growth for FY24. SNOW is still producing a crazy high NDR, currently at 158%.
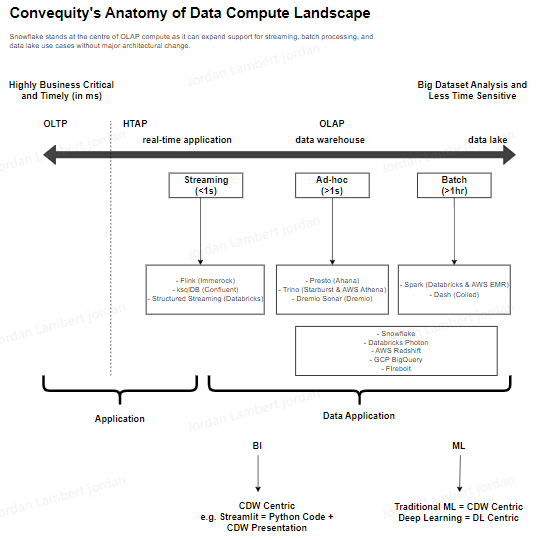
SNOW is not without many competitors on the compute and storage front that are catching up and offering viable alternatives. There are various open-source component combinations that can provide enterprises with lower costs and avoidance of vendor lock-in. However, with such open-source approaches there are tradeoffs whereby enterprises must accept weaker security/governance, higher maintenance, oftentimes weaker performance, and ultimately, poorer user experience. So, our take is that Databricks will close the gap on SNOW, but to do so it will need to introduce increasingly more close-sourced components.
The SNOW vs Databricks rivalry is akin to AAPL vs GOOGL during the 2010s in the smartphone market. AAPL was/is the closed-sourced market leader by a wide margin, and GOOGL was the open-sourced player trying to close the gap in UX. However, to close the UX gap, it found itself adding more and more closed sourced components. As Databricks follows a similar path, it will take the cost leadership position (in a similar manner to how Android has in the smartphone market), but will have compromised its reputation in the open-source communities.
Having a closed-sourced tech stack gives SNOW, like AAPL, way more control over its future. In particular, SNOW owns its proprietary storage format, that not only empowers it to make performance tweaks faster than open-source alternatives, but enables it to expand into huge future areas like data sharing, which can only be done when the storage layer is under tight control.

SNOW is richly priced as the market appears to be pricing in complete domination by SNOW. Our take is that the moat is solid and will continue to strengthen, but at the same time SNOW will lose a portion of the market to lower cost, open-source players. For a talented bunch of engineers, it is very achievable to copy SNOW with open-source components, and this is what is not being priced in by the market at large. SNOW's advantage, however, is its business model focused on the end-to-end user experience and the creation of a tight ecosystem, in a similar vein to what AAPL has achieved.


