

Convequity MSU Framework For Enhanced Risk-Reward Analysis
Summary
- We are introducing a new framework to compliment our technology focused research which is intended to provide better risk-reward around Convequity's stock recommendations.
- The MSU (Market, Street, and Us) framework aims to illuminate where our views on a stock differ to the market and the street and to better understand the risk-reward.
- We will be applying MSU on a number of stocks over the next few weeks. Here we share some thoughts regarding its application.
Preface
At Convequity, our core mission is to deliver in-depth fundamental research on technology companies, focusing on their product development, architectural strategies, and overarching vision. This specialized approach allows us to offer unique perspectives that aid investors in the nuanced task of portfolio management. As we step into 2024, the landscape of growth technology is noticeably more recognized and crowded than it was, in both the private and public markets, back in 2019. This shift highlights the evolving nature of the sector and underscores the need for adaptive investment strategies.
Our insights into various companies remain robust, yet we observe periods where market valuations swing dramatically. At times, positive attributes of companies are excessively factored into share prices, while at other times, they are undervalued. This volatility in market perception affects the utility of our fundamental research for managers who strive to balance risk and optimize their risk-reward strategies in alignment with market dynamics. Traditional methods like DCF analysis and relative valuation multiples offer a baseline for understanding how our views diverge from general market sentiment. However, these methods alone are insufficient to fully capture the complexity of the current investment environment.
Therefore, we emphasize the necessity of an additional analytical framework. This framework should not only complement our existing valuation methods but also provide a nuanced understanding of how our perspectives differ from the market. This is crucial for a more accurate assessment of risk-reward balances and the margin of safety in investment decisions.
Moreover, a key component of successful investment strategy extends beyond the development of a solid thesis. It involves a deep understanding of the behavior and strategies of other market participants. Recognizing the roles and potential influences of these participants is essential. As the saying goes, "If you don't know who the fool in the market is, there's a good chance it might be you." This statement underscores the importance of comprehensive market awareness. By integrating this broader market understanding with our specialized research, we aim to equip our readers with the insights needed for effective portfolio management in a dynamic and evolving tech investment landscape.
MSU Framework
We have developed the MSU Framework to articulate where the views of the Market and the Street differ from Us, and will be explicitly incorporated into our analytical approach going forward. We will continue to do deep dives into the technological aspects of companies so we can share the long-term competitive advantages. Though, the MSU Framework will assist in a clearer understanding of where we differ from the market and street.
One impetus for developing MSU has been observing our difference in views on FTNT, PANW, and PLTR over the past few years and how they were gradually assimilated by other market participants. The difference in views narrowed to the point whereby these stocks have traded close to or within our estimated fair value range. However, in each of these cases, it took 2-3 years for our views to be validated by the Market and Street. During that period, expectedly, investors following our research doubted the thesis and many exited positions before the thesis came to fruition. Perhaps had we introduced MSU earlier, it would have helped such investors better appreciate the contrarian theses.
The reason many investors exit too early is because it takes longer than expected for the market to agree with their view. Being too far ahead in one's predictions can be indistinguishable from being correct - we think this applies to our long-term 'avoid' view of ZS. We've done a lot of research on ZS and have high conviction that the company will not evolve into a perennial innovator on the cutting edge of cybersecurity. We have had a negative view on ZS since 2020, but perhaps our view has been too heavily influenced by its technology and not enough by the impressive GTM. By applying MSU in a systematic way, we can merge our deeper understanding of a company's technology with the current views of the Market and the Street, and accordingly, create content with greater utility for investors.
Applying MSU will also be useful for our coverage of historically hotter stocks. We do like to dive deep into the tech of the likes of NET and SNOW, but given the rich multiples, such research is not always value-add to our subscribers. By applying MSU we can be more aware of when our views (U) are too similar to the market (M) and street (S) to warrant extensive research, despite what we believe to be companies with great prospects on the business front. Another benefit of MSU will be identifying investment opportunities in what we describe as Tier 2 stocks. As Convequity appreciates BoB technology, sometimes we overlook the Tier 2 companies that may not be at the cutting-edge of innovation, but nonetheless present investors with promising future excess returns. Applying MSU to such stocks would uncover additional alpha opportunities.
Here we breakdown the MSU Framework, which involves a detailed analysis and comparison of views from three key market participants:
- M - Market: This encompasses the general market, including all types of participants. The market price reflects actions of the marginal buyer, influenced by various groups like retail investors, and buy-side and sell-side institutions, among others. In the short term, the market behaves like a voting machine, reflecting immediate sentiment. In contrast, over the long term, it functions more like a weighing machine, assessing the fundamental value.
- S - Street: This category includes professional and institutional investors, notably major investment banks and fund managers who often align closely with these banks' perspectives. However, there are notable exceptions like Elliott Management, Scion Capital, and Appaloosa Management, which maintain a distinct stance away from the mainstream 'Street' view.
- U - Us (Convequity): Our primary objective is to generate independent, unbiased research. We start by analyzing fundamentals without being influenced by the prevailing market or street views. Subsequently, we engage in a comparative analysis, examining how our insights stack up against the prevailing sentiments of the market and the street, along with other influential players.
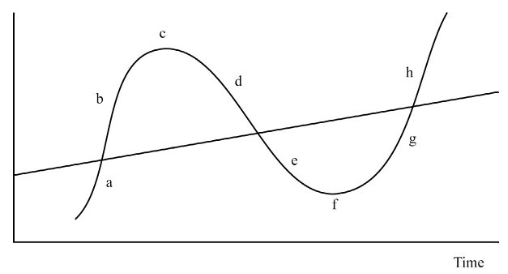
In our framework, the positions of M, S, and U can be broadly categorized as either positive (+) or negative (-), with occasional neutral stances. However, it's crucial to recognize that the market seldom maintains a stable equilibrium. It is more akin to a pendulum, swinging between extremes. Understanding these dynamics is vital in applying the MSU Framework effectively, as it allows us to anticipate shifts and adjust our strategies accordingly. This approach enables a more refined perception of market movements, enhancing our ability to make well-informed investment decisions.
In the MSU Framework, we've identified eight distinct scenarios, each with varying levels of potential returns. These scenarios help us understand how different market participants' views align or diverge, providing a strategic guide to potential investment opportunities:
- M-, S-, U+ (Contrarian Opportunity): Here, both M and S hold a bearish view, but our analysis (U) identifies positive potential. This scenario is a classic contrarian opportunity, where our deep insights into a company's underlying strengths, untapped growth opportunities, or emerging industry trends set us apart from the general market sentiment. The strategy in this scenario hinges on the strength and conviction in our research. Although there is a risk in opposing the broader market view, the potential rewards are substantial if our analysis proves accurate and the market and analysts adjust their perspectives. In this scenario, the risk-return ratio is often favorable, as most of the downside risk is already factored into the current valuation. Thus, any positive development may lead to significant share price appreciation, often amplified by factors like market FOMO (Fear of Missing Out) and short-covering.
- M-, S+, U+ (Analyst-Backed Potential): In this scenario, the market undervalues a stock, but both analysts and our research recognize its potential. Our concurrence with analysts might stem from shared insights into the company's innovation, effective management, or potential for market expansion. The investment opportunity here lies in the possibility of the market eventually recognizing and adjusting to the stock's true value, which can result in significant appreciation. To capitalize on this scenario, it's crucial to have confidence in our research and the analysts' projections, even if the market remains bearish for a prolonged period. Compared to the first scenario, the return potential might be relatively lower due to less contrarian positioning, but the likelihood of a positive outcome is enhanced by the backing of both Convequity and street analysts, reducing the uncertainty around catalysts for market reevaluation.
- M+, S-, U+ (Market-Driven Optimism): In this scenario, M exhibits a bullish sentiment, while S remain cautious or bearish. Contrasting with the analysts, U aligns with the market’s optimism, indicating that we may have identified potential benefits or opportunities overlooked by analysts. This could be due to our unique insights into specific market drivers, technological advancements, or unexplored niche market segments. While there is a risk that analyst opinions might eventually influence and sway market sentiment, aligning with the market's current optimism presents an opportunity for significant gains. The potential return in this scenario might be somewhat moderated, as the market has already priced in many positive aspects that we agree with. However, the scenario often evolves when analysts begin to acknowledge the market's perspective, leading to a later stage in the bull run where appreciable gains can still be realized, as was seen with Tesla's re-rating by analysts in 2020-2021.
- M+, S+, U+ (Unified Positive Sentiment): Here, there is a unanimous positive sentiment from the market, analysts, and our own analysis, indicating a strong collective confidence in the stock. This agreement suggests that the stock is widely recognized for its solid fundamentals, strategic market position, and promising growth potential. However, the consensus also suggests that there might be limited room for further upside, as the positive factors are likely well-reflected in the stock’s current price. Investing in this context is generally considered safer because the asset is recognized as high-quality for sound reasons by all market participants. Nonetheless, it's critical to stay alert to any shifts in market dynamics or potential signs of overvaluation because for such highly regarded stocks, even a minor execution misstep can lead to disproportionately negative reactions, while significant positive developments might only have a muted impact on the stock price. An example of this can be observed on SNOW since its IPO, where its consistently high valuation has reflected a strong market consensus but also limited the potential for significant price increases.
- M-, S+, U- (Market Skepticism with Analyst Optimism): In this scenario, S have a bullish outlook on a stock, whereas both M and U adopt a bearish stance. This divergence may stem from our emphasis on potential risks and challenges that we believe analysts might be overlooking. Such factors could include competitive pressures, regulatory issues, or financial vulnerabilities that could impact the company's performance. In this scenario, a cautious approach is warranted, prioritizing risk aversion, particularly if we assess the analysts' optimism as misplaced or overly optimistic. However, flexibility is key; we should remain open to revising our view if new, compelling information emerges that aligns more closely with the analysts’ positive perspective. Our difference in opinion with analysts often arises from our deeper understanding of the company's product, architecture, and strategic vision. When this bearish view is shared by the market but not by analysts, it often indicates a lag in the analysts' response to emerging market realities or changing business dynamics.
- M+, S-, U- (Contrast between Market Enthusiasm and Analytical Caution): This scenario presents a situation where M is bullish, but both S and U are bearish. Such a configuration might signal speculative market behavior or a temporary market trend that is driving up the stock's price without solid fundamental backing. Our bearish stance could be informed by concerns about the company's long-term sustainability, financial stability, or existing and emerging competitive threats. In these instances, it is generally advisable to resist the temptation to follow the market's bullish trend. Instead, relying on our cautious analysis, in line with the analysts' skepticism, is often the more prudent course of action. This approach helps avoid potential pitfalls associated with market hype or temporary enthusiasm that is not grounded in the company's fundamental value. A notable example of this scenario was observed with C3.ai in February 2021, where market enthusiasm contrasted sharply with a more cautious view from analysts and our own analysis, highlighting the need for a disciplined, research-backed investment strategy.
- M+, S+, U- (Cautious Stance Amidst Market and Analyst Optimism): This scenario presents a unique challenge where both the market and analysts exhibit an optimistic outlook, but our analysis remains negative. Such a divergence typically suggests potential overvaluation, where we identify risks or challenges that might be overlooked by the market and analysts. Our cautious stance could be driven by factors such as unsustainable valuation metrics, technology that is excessively hyped, or imminent market saturation risks. In this context, a careful and potentially contrarian approach is advised. Our analysis may indicate that a market correction or a decline in the stock's value is on the horizon, warranting a decision to avoid investment. Instances like this demand a robust justification for our bearish stance, especially when it contradicts the prevailing market sentiment. Historical examples include companies like Zscaler and DigitalOcean (DOCN) in November 2021, where the market and analysts were bullish, but underlying factors suggested caution was necessary.
- M-, S-, U- (Consensus Negative Sentiment): In this scenario, there is a unanimous negative sentiment from the market, analysts, and our own analysis. Such a consensus is a significant red flag, often arising from clear and serious issues with the company. These might include severe financial troubles, fundamentally flawed business strategies, or overwhelming external challenges that the company faces. Investing in a stock under these conditions is generally considered highly risky, with a pronounced likelihood of loss. Prudence dictates avoiding such investments unless there is substantial and credible evidence suggesting a potential turnaround. However, such cases are relatively rare and require a meticulous evaluation of any new developments that might alter the company’s trajectory. An example of this scenario was seen with Cisco in November 2021, where widespread negative sentiment was driven by a combination of challenging factors, signaling a strong caution against investment.
How to Measure MSU
Despite MSU being simplistically depicted with - and + signs, such analysis is far from binary. Therefore, we will assess the magnitude of - and + with valuation analysis, in a similar vein to how we compliment the current tech-focused research. This will include DCF valuation analysis as well as Rule of 40 merged with EV multiple analysis.
Measuring the U, or whether it is U- or U+, is straight forward because it simply requires us to conduct a valuation and compare it to current share price of the stock under analysis. The magnitude of the - or + on U would be subject to the degree of valuation discrepancy derived from the DCF valuation.
To add some quantification to M, we will use a simplified DCF valuation model and set the revenue growth and FCF margin curvature so that it derives an EV or EV multiple that equals the current EV or EV multiple. By doing that, we can compare the market's growth and profitability expectations versus the company's guidance and our own projections. For S, we will review BB analyst reports to get a sense of where the majority of analysts are positioned the stock under examination.
MSU shifts
Understanding the dynamics of MSU shifts is integral to applying the MSU Framework effectively in portfolio management. The MSU analysis provides a snapshot of our current positioning relative to other market participants, but it's equally important to anticipate potential shifts in these positions over time. This forward-looking approach allows for a more nuanced management of risk and reward in investment decisions. We generally encounter two types of scenarios in MSU shifts: