
Investor Guide: Forecasting Terminal FCF Margin Of B2B Software Companies (Pt.3)
Summary
- The report introduces the Terminal Opex & Capex Framework for estimating a software company's terminal opex and capex - part of the overarching Terminal FCF margin Framework.
- The framework takes into account market factors such as market type, revenue model, market concentration, and software criticality, as well as various other insightful considerations.
- The article provides insights on how these factors can influence a company's opex and capex at the mature stage of business.
Recap
In Part 1 we introduced the Terminal FCF Margin Framework, used for forecasting a software company’s potential terminal FCF margin when they reach a low-growth, mature stage of business. The framework is supposed to be more of an explorative tool for contemplating a stock’s terminal FCF margin, rather than a deterministic formula, which is not possible in the world of investing. As a recap, it consists of three sub-frameworks for estimating a software company’s terminal FCF margin:
- Terminal Gross Margin Framework
- Terminal Opex & Capex Framework
- Terminal working capital changes points of consideration
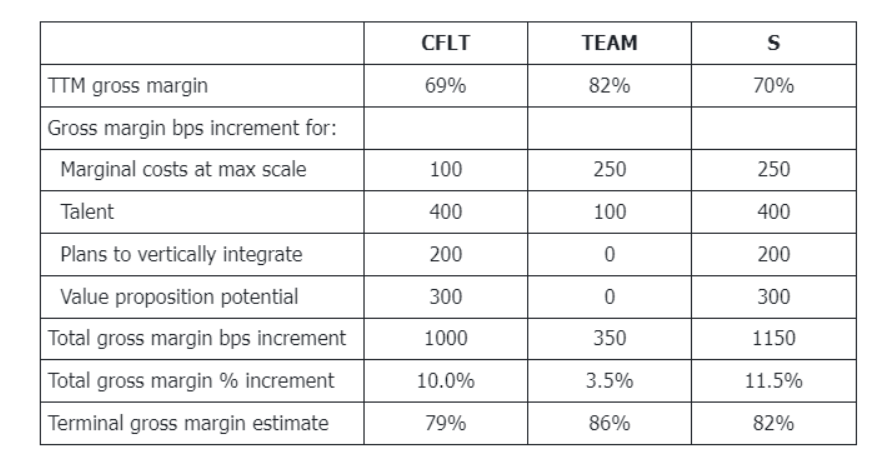
Following the introduction of the overall framework, Part 1 provided the details of how to apply the Terminal Gross Margin Framework for estimating a company’s terminal gross margin, using Cloudflare (NET) as a running example throughout. In Part 2, we applied the Terminal Gross Margin Framework to Confluent (CFLT), Atlassian (TEAM), and SentinelOne (S), discussing each factor of potential gross margin increments in detail and then using it to estimate their terminal gross margins, shown below.
In Part 3 we will discuss and apply the Terminal Opex & Capex Framework. This framework involves creating a number of categorizations using a hierarchy of factors, and then testing whether we can use these categorizations to forecast a mature-stage software company’s opex and capex, as a percentage of revenue. The opex and capex items are S&M %, R&D %, G&A %, SBC %, and Capex % (each as a percentage of revenue). Once we understand these factors, we can estimate how a current high-growth and high-opex software company, might evolve its opex and capex as it evolves toward its terminal state. Please note, the nature of this research is explorative rather than an attempt to seek a deterministic or conclusive forecasting model.
The Factors
Here, we will briefly discuss the factors, and in the next section we will apply them to each component of the Terminal Opex & Capex Framework. We have divided the factors into two broad categories: market factors and other factors. The market factors are used to create a model for categorizing mature-stage software companies, and can be considered market-oriented or external factors. As we’re going to hypothesize how these factors will influence the opex and capex items, it makes sense to create a model in which to categorize companies so we can then empirically check whether the hypothesis is accurate or not. The other factors are considered internal factors and are separated because they are not easy to fit in with the hierarchy of market factors - this will become clearer as you read through the report.
Market Factors
Market Type: Brownfield vs Greenfield
Whether the software company operates in a brownfield or greenfield market will have a big influence on its terminal S&M %, R&D %, G&A %, SBC %, and capex %. Brownfield markets are characterized by being old and mature with established incumbent vendors, and almost all B2B organizations are already customers. New entrants to the market are aiming to succeed via replacement sales as they are targeting customers who already have a solution in place from an incumbent vendor. Hence, most of the new entrant’s S&M effort is in persuading the customer that their solution is far greater than the incumbent’s.
In contrast, greenfield markets are young, new and immature, with most B2B organizations not yet having the product/solution implemented, and some may not even know of the market’s existence. In greenfield markets there are no established incumbents yet and B2B orgs do not have any similar solution in place, hence most of the vendor’s S&M effort is in convincing customers that they need this novel solution rather than persuading them that their solution is better than an incumbent’s.
To remind ourselves of the perspective here, the purpose is to take a high-growth, high-opex software company, and run it through the Terminal Opex & Capex Framework to estimate the mature-stage opex items and capex as a percentage of revenue - presumably, this mature-stage will come about many years into the future. In the present, some companies we choose might be in a greenfield market or one transitioning to a brownfield market, though one would expect that they will be operating in a mature brownfield market when they finally reach their mature stage as a business. So, most of the time as we apply this framework, the expectation is that the market the company is operating in when they reach mature-stage, is a brownfield market. However, there are possibly a few exceptions to this general view. For instance, the graphic design market has been around for almost as long as the PC, but due to paradigm-shifting innovations over the decades, such as super-powered chips, SaaS/cloud computing, and most recently GenAI, it feels like this may forever be a greenfield market, bringing in new customer types and use cases. Adobe is a good example to this point, because had we applied this framework to Adobe 15 years ago, we probably would have assumed they would be operating in a brownfield market today, though it happens that a substantial part of their business is in a greenfield market.
Revenue Model
In Part 1, the Terminal Gross Margin Framework, we extensively discussed the nuanced impacts that the revenue model – License vs SaaS, and Consumption vs Per Seat/Endpoint – will have on a software company’s terminal gross margin. Additionally, the revenue model will have a substantial influence on the terminal opex items and capex.
Landing a new logo might incur greater S&M expenses in SaaS compared to license-based software, mainly because it is a more competitive landscape and more dollars are needed to grab customers’ attention. However, once a customer relationship has been established, compared to an equivalent license-based vendor, the SaaS vendor should have a lower S&M % for follow-on sales to the customer. As a company matures and the high majority of the customer base are existing customers, the S&M benefits of SaaS should grow.
Within SaaS, opex items and capex will also be affected by the type of SaaS revenue model – consumption-based versus per seat/endpoint. For instance, during an economic upswing, consumption-based models, like Snowflake's and JFrog's, typically have higher NDR because they benefit as customers add more users and as users increase their consumption of resources. This would lead to greater scale economics, leading to lower COGS %, lower opex %, and higher FCFs. However, in a downturn, consumption-based SaaS vendors are more vulnerable than per seat/endpoint vendors because a reduction in consumption occurs before layoffs, whereby customers push consumption out to the future and focus on spending their existing credits. This would lead to a decrease in scale economics, leading to higher COGS%, higher opex %, and lower FCFs.
Market Concentration: Consolidation or Fragmentation
The degree of market concentration will undoubtedly have a significant impact on a software company’s terminal opex and capex items. It is reasonable to expect a company, that ends up as one of a few major players in a mature, consolidated market, will be able to radically reduce their opex %, simply because of the less intense competition. Networking has become a consolidated market because for a company to succeed, they must reach a large scale to make the capex investments worthwhile. Those who have not reached the required scale have been acquired (3Com) or liquidated (Nortel Networks), leaving only a few major players to compete, such as Juniper Networks, Arista Networks, and F5 Networks, all of which can afford to lower their opex to achieve 20%+ EBITDA margins.
On the other hand, a company operating in a highly innovative sector of software might experience a lack of market consolidation. The ensuing fragmented market forces companies to keep opex % elevated in order to maintain a cycle of innovation and win customers. The work management space is a good example here, as it is a fragmented, and in many respects, a greenfield market, with many competitors such as Smartsheet who have only very recently become EBITDA breakeven due to the S&M and R&D required to survive. In light of this competitiveness, we applaud Monday's recent profitability execution while maintaining high growth, because its competitors are spending more opex % while achieving lower growth. If investors can identify companies with great execution in a fragmented market, then the growth potential is far greater than identifying a company with great execution in a consolidated market. However, the flipside is that the fragmentation poses greater business risks and the possibility of failure. Although there is a lack of pure-play public cloud security companies at present, we suspect this could be another market in the future whereby players are pressured into sustaining high opex % to compete.
Software Criticality: Mission or Non-Mission Critical?
Is this business mission critical (MC), such as network security? Or is it more of a 'nice-to-have', like content collaboration tools? MC businesses certainly have more power over existing customers, because they minimize churn and have more bargaining power to implement price increases. Even if a customer is unsatisfied with the service and/or does not see the value in the price increase, it might be too risky to discontinue the relationship and change vendor. For example, switching networking provider is fraught with business disruption risk that could severely affect revenue generation, productivity, and costs.
Sectors such as data, networking, and cybersecurity are MC, and you can get MC sectors/businesses in both consolidated and fragmented markets. For instance, cloud data warehouse and networking markets are consolidated and MC, while cloud security and EDR/AV markets are fragmented and MC. As touched on the previous section, a consolidated MC market may be a safer place for investors to pick a company, though the fragmented MC market holds the potential for more growth if investors pick one of the companies that will execute well. As long-time subscribers will know, our pick for a fragmented MC market has been SentnelOne for a while, as we expect they will gain substantial market share over time.
Market Factor Model of the Terminal Opex & Capex Framework
The following Market Factor Model puts the above factors into a hierarchical tree-like diagram, resulting in nine categories. For each category, numbered 1 to 9, there are example sectors and companies. Below the examples are the labels assigned to the opex and capex items for each category. The labels shown are our estimates, or hypotheses, for what level we think terminal S&M %, R&D %, etc., will be for a mature-stage company in the respective category. The ranges associated with these labels are shown underneath.